End-to-end demonstration
What you're seeing
The demo puts the platform under real stress — a node is deliberately killed mid-operation, and the infrastructure responds automatically. No manual intervention. No downtime.
- Node failure simulated — a cluster node is interrupted while Odoo is serving traffic
- Automatic rescheduling — Docker Swarm detects the failure and reschedules affected containers to healthy nodes
- Odoo stays reachable — HAProxy continues routing traffic throughout the disruption
- Redis failover triggered — a replica takes over the cache layer without data loss
- Live monitoring throughout — Grafana dashboards show cluster state, request rate, and recovery in real time
System overview
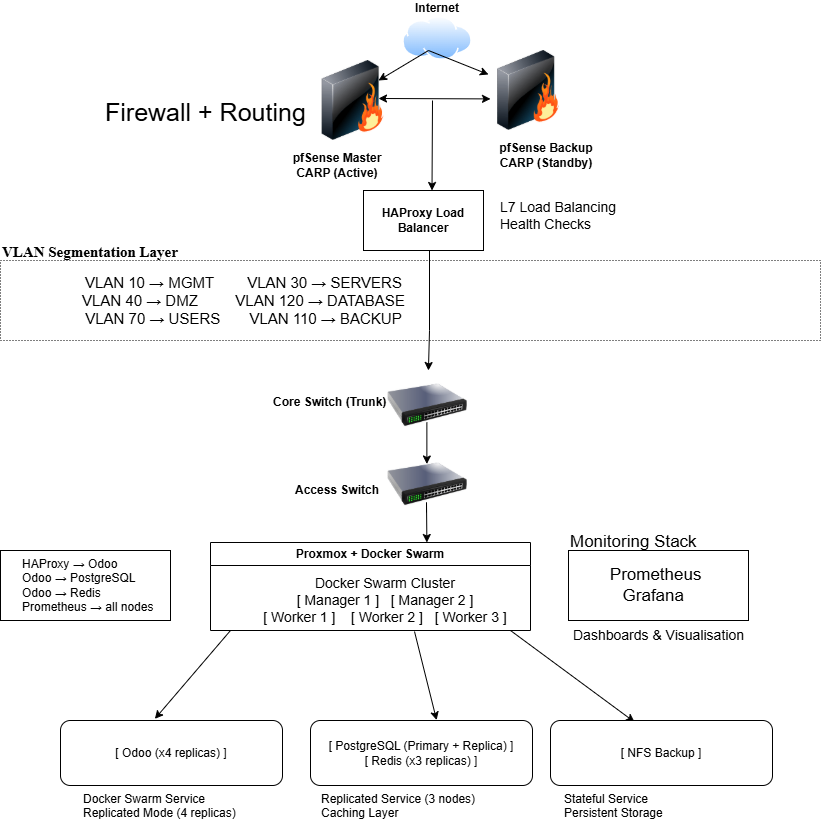
COMPUTE LAYER → Proxmox VE · 8–12 KVM VMs · cluster quorum + shared storage
ORCHESTRATION → Docker Swarm · 5-node · replicated services · health-aware scheduling
LOAD BALANCING → HAProxy · backend health checks · automatic failover routing
DATA LAYER → PostgreSQL + Redis · replication + replica failover · NFS-backed persistence
OBSERVABILITY → Prometheus + Grafana · live dashboards · alerting · metrics endpoints
DELIVERY → GitLab CI/CD · validate → deploy → verify · ~60% less manual work
Proxmox Cluster
Virtualised infrastructure hosting 8–12 VMs across multiple isolated nodes. Snapshot-based recovery and shared NFS storage underpin the backup strategy.
pfSense
Routing, firewalling, and VLAN-based segmentation across 10+ networks — enforcing strict isolation between tenant, management, DMZ, and Wi-Fi segments.
Docker Swarm
Five-node container orchestration with replicated services, health-aware scheduling, and automatic rescheduling on node failure.
HAProxy
Load balancing across replicated Odoo containers with backend health checks and traffic failover — keeping the application accessible during node disruptions.
PostgreSQL & Redis
Persistent data layer with replication for durability and Redis caching with replica takeover for low-latency failover.
Prometheus & Grafana
Full observability stack: live metrics collection, alerting rules, and purpose-built dashboards reflecting cluster health in real time.
Key features
High Availability
Replicated services, HAProxy failover, and Redis replica takeover — validated under live node interruption with zero downtime.
Network Segmentation
pfSense enforces strict boundaries across 10+ VLANs: tenant workloads, management interfaces, and DMZ services cannot cross-contaminate.
CI/CD Automation
GitLab pipeline covers validation, deployment, and post-deploy verification — cutting manual configuration effort by ~60%.
Observability
Prometheus scrapes metrics from infrastructure components; Grafana surfaces cluster health, resource pressure, and request rates in live dashboards.
Backup & Recovery
NFS-backed persistent storage combined with Proxmox VM snapshots gives point-in-time recovery for both the platform and its data layer.
Failure Simulation
Node kills and service interruptions tested under realistic load — proving the architecture holds before the grade submission.
Implementation focus
- Proxmox cluster setup: Provisioned 8–12 VMs across nodes with shared NFS storage; configured quorum and snapshot policies for recoverability.
- pfSense VLAN design: Mapped 10+ VLANs to functional segments (tenant, management, DMZ, Wi-Fi, CCTV); wrote firewall rules enforcing least-privilege cross-segment access.
- Docker Swarm orchestration: Defined Swarm services with replica counts, restart policies, and health check thresholds; assigned node roles to control workload placement.
- HAProxy configuration: Wrote backend definitions with active health checks and failover timeouts; validated that traffic rerouted cleanly when nodes went dark.
- PostgreSQL & Redis replication: Configured streaming replication for the database and Redis replica promotion — tested each failover path explicitly.
- GitLab CI/CD pipeline: Built three-stage pipeline: lint/validate → deploy → smoke-test; parameterised environments to support multi-tenant rollouts.
- Prometheus & Grafana stack: Wrote scrape configs targeting all services; built dashboards for cluster health, Odoo request metrics, and database lag.
What this demonstrates
- End-to-end ownership of a production-grade infrastructure platform — from VM provisioning to CI/CD and observability
- Network engineering depth: VLAN design, firewall policy, and traffic isolation across 10+ segments
- Container orchestration beyond the basics: Swarm replica management, health-aware scheduling, and verified failover
- Database operations under pressure: replication, failover, and persistence strategy for a live SaaS workload
- Automation discipline: GitLab CI/CD cutting deploy effort by ~60% through repeatable, testable pipelines
- Observability-first mindset: metrics collection and dashboards built alongside the platform, not bolted on after